Cookies management by TermsFeed Cookie Consent
Recent News

Press Releases

05-04-2018 12:58

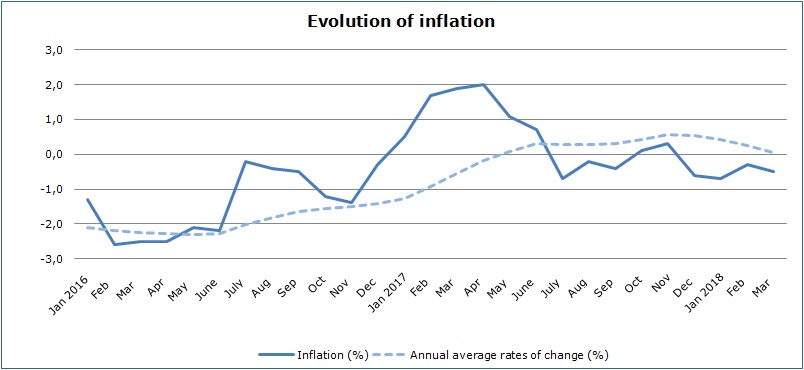
Consumer Price Index: March 2018

Inflation -0,5%
 
In March 2018, the Consumer Price Index (CPI) increased by 0,71 units to 99,27 units compared to 98,56 units in February 2018. Compared to March 2017, the CPI is decreased by 0,5% while for the period January-March 2018, the CPI is decreased by 0,5% compared to the corresponding period of the previous year. (Table 1)
 
In the 12-month period, from April 2017 to March 2018, in comparison to the period from April 2016 to March 2017, the annual average rate of change of the CPI was 0,1%. The corresponding annual average rate of change of the CPI in the previous 12-month period was -0,6%.
 
 
As regards the economic origin, the largest change was recorded in Electricity with a decrease of -6,5%, when compared to the index of March 2017, while in comparison to the index of the previous month an  increase of 1,3% was observed. (Table 2)
 
Analysis of changes
Compared to March 2017, the largest changes were noted in Clothing and Footwear (-3,1%) and Food and Non-Alcoholic Beverages (-2,8%), whereas an increase was recorded in Transport (2,9%). (Table 1)
 
In comparison to the CPI of February 2018, an increase was noted in Clothing and Footwear (6,9%). (Table 1)
 
For the period between January-March 2018, compared to the corresponding period of the previous year, the largest negative change was noted in Food and Non-Alcoholic Beverages (-4,3%), while an increase was recorded in Transport (2,6%). (Table 1)
 
Analysis of effects
The categories with the largest effect on the change of the CPI of March 2018, compared to the previous month, were the Clothing and Footwear (0,46). (Table 3)
 
The products/services with the most notable effect on the change of the CPI of March 2018 compared to the previous month were clothing (0,28) and footwear (0,18). (Table 4)


Table 1

Categories of Goods and

Services

CPI (2015=100)

Change (%)

Feb 2018

Mar 2018

Mar 18/ Mar 17

Mar 18/ Feb 18

Jan- Mar 18/     Jan- Mar 17

Food and Non-Alcoholic

Beverages

97,41

98,25

-2,78

0,86

-4,28

Alcoholic Beverages and Tobacco

97,28

97,50

-2,01

0,23

-1,82

Clothing and Footwear

92,81

99,22

-3,06

6,91

-2,53

Housing, Water, Electricity, Gas and Other Fuels

100,36

100,58

-0,86

0,22

0,28

Furnishings, Household Equipment and Routine Maintenance of the House

95,24

95,80

-2,25

0,59

-1,87

Health

101,99

101,87

0,43

-0,12

0,50

Transport

98,86

98,76

2,92

-0,10

2,60

Communication

97,35

97,30

-0,53

-0,05

-0,71

Recreation and Culture

99,61

99,49

-0,09

-0,12

0,09

Education

103,09

103,09

2,32

0,00

2,32

Restaurants and Hotels

101,17

101,66

1,16

0,48

0,92

Miscellaneous Goods and Services

98,80

98,98

-0,42

0,18

-0,31

General Consumer Price Index

98,56

99,27

-0,49

0,72

-0,50


Table 2

Economic Origin

Weights

Change (%)

Mar 18/

Mar 17

Mar 18/

Feb 18

General Index

10000

-0,49

0,72

Agricultural goods

655

-5,77

1,71

Industrial goods (excl.                           petroleum products)

4195

-1,55

1,45

Electricity

319

-6,49

1,25

Petroleum products

550

-0,58

-0,82

Water

57

-2,78

0,00

Services

4224

1,92

0,16


Table 3

Categories of Goods and Services

Weights

Effect (units)

Mar 18/  

           Feb 18

Food and non-alcoholic beverages

1906

0,16

Alcoholic beverages, tobacco

347

0,01

Clothing and footwear

721

0,46

Housing, water, electricity, gas and other fuels

1119

0,02

Furnishings, household equipment and routine maintenance of the house

644

0,04

Health

637

-0,01

Transport

1524

-0,02

Communication

439

0,00

Recreation and culture

575

-0,01

Education

392

0,00

Restaurants and hotels

836

0,04

Miscellaneous goods and services

860

0,02

General Consumer Price Index

10000

0,71

Note: Totals are calculated on the basis of the effects of the categories with infinite decimal figures and rounded up to two decimals when published. Figures may not add to totals due to rounding error.


Table 4

Goods/Services

Effect (units)

Mar 18/ Feb 18

Positive effect


Clothing

0,28

Footwear

0,18

Fresh Vegetables

0,07

Soft Drinks

0,06

Other goods and services

0,12

TOTAL

0,71


METHODOLOGICAL NOTES
 
Definitions
 
The Consumer Price Index (CPI) is compiled to measure the changes of prices over time of consumer goods and services acquired, used or paid by households. Specifically, the national CPI of Cyprus covers the consumption expenses of specific goods and services (shopping basket of goods and services), of the resident households and of the households that intend to live in Cyprus for at least one year. CPI is the official index for the estimation of inflation.
 
The inflation shows the change of the CPI, when compared with the index of the corresponding month of the previous year.
 
The effect represents the amount of the overall change in the General Index, which is accounted for by any given category.
 
Collection
 
The price collection is carried out only in urban districts of Nicosia, Larnaca, Limassol and Paphos. For each city, the fluctuations in the product prices each month are weighted according to their population. Specifically, the weights for the four districts are: Nicosia 42%, Limassol 30%, Larnaca 18% and Paphos 10%.
 
The prices of 805 goods and services are recorded once every month, except for some seasonal products (e.g vegetables and fruits), meat and fuels, whose prices are collected every week (every Thursday).
 
Base year
 
The index reference period was 2005=100 for the period between January 2006 and December 2015. From January 2016 and onwards, the base year is 2015=100.
 
Classification    
                                                                                                            
Until December 2015, COICOP4 classification was used for the calculation and the dissemination of the CPI. From January 2016 and onwards, CYSTAT is adopting the ECOICOP classification satisfying relevant Eurostat’s Regulation. In other words, the lowest level of detail for the classification used in CPI is COICOP 5-digits.
 
Products/Services and weights
 
From January 2018 and onwards, the products included in the CPI as well as their corresponding weights have been revised. The revision was based on the results of the Household Budget Survey 2015/2016.
 
Further information
Constandia Papageorgiou: Tel: +35722602116, E-mail: cpapageorgiou@cystat.mof.gov.cy
Andri Eftychiou: Τel: +35725878595, E-mail: aeftychiou@cystat.mof.gov.cy
 
_____________
(EA/SCH)