Press Releases
25-01-2021 15:47
Social Protection Survey: 2018
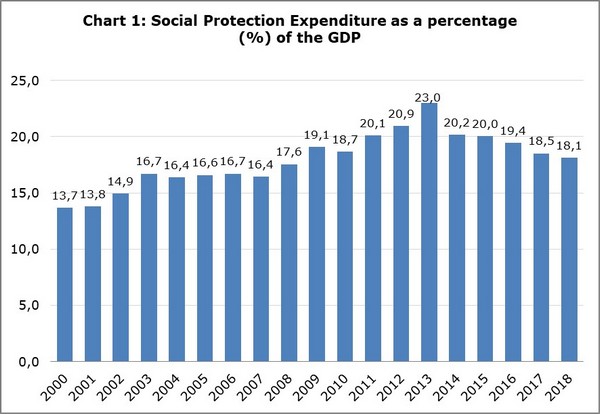
According to the results of the Social Protection Survey, which is based on the principles and rules determined by the European System of Integrated Social PROtection Statistics (ESSPROS) the social protection expenditure in Cyprus, as a percentage of the GDP, reached 18,1% in 2018, compared to 18,5% in 2017 (Chart 1), which corresponds to €3.884,9 million in 2018, compared to €3.724,6 million in 2017 (Table 1).
Distribution of Social Protection Expenditure by Function
As it is indicated in Chart 2, the most significant functions were those of old age and sickness/healthcare, which combined, constituted 67,3% of the social protection benefits for 2018 (compared to 66,7% in 2017). The largest share of old age benefits (which comprise both cash benefits, i.e., periodic pensions and benefits, and lump sum benefits, as well as old age benefits in kind like housing, provision of assistance in carrying out daily tasks and other benefits in kind), concerns periodic pensions which amounted to €1.658,8 million and which constituted 90,9% of the total old age benefits. It is worth noting, that the €1.605,4 million of the periodic pensions that were granted to beneficiaries in 2018, were non-means tested, i.e., without verification of the recipients’ financial situation (Table 2).
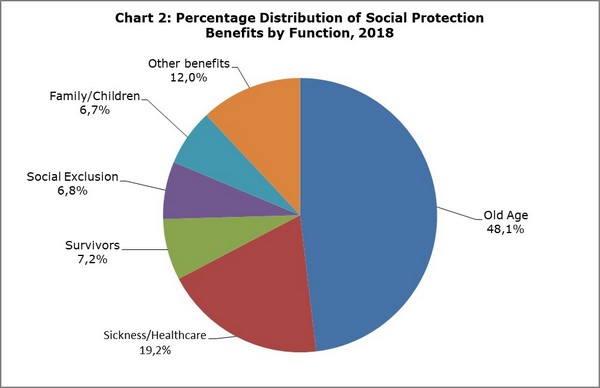
There was an increase in the social benefits of the function of old age in 2018, which amounted to €1.824,1 million (compared to €1.763,4 million in 2017), the function of sickness/healthcare with the social benefits amounting to €727,5 million in 2018 (compared to €665,6 million in 2017), the function of survivors which amounted to €274,3 million in 2018 (compared to €267,6 million in 2017), the function of family with €253,8 million in 2018 (compared to €242,8 million in 2017), the function of disability with €175,7 million in 2018 (compared to €164,1 million in 2017) and the function of unemployment which also had a slight increase in 2018 with social benefits which amounted to €209,6 million (compared to €208,0 million in 2017). On the contrary, a decrease in social benefits was recorded in the function of social exclusion, which amounted to €256,5 million (compared to €259,1 million in 2017), as well as in the function of housing which amounted to €69,2 million (compared to €70,1 million in 2017) as presented in Table 3.
Distribution of Social Protection Benefits in ESSPROS Categories
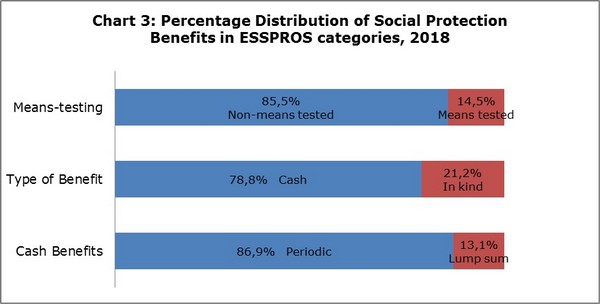
Most of the social protection benefits that were provided to beneficiaries in 2018 (85,5%), were non-means tested benefits. Specifically, this accounts for €3.241,3 million in 2018 (Table 1). In most cases, the beneficiaries, having made cash contributions to various insurance funds (e.g. the Social Insurance Fund), gain the right to benefits, without their income being a criterion. In other words, most social protection benefits are not explicitly or implicitly conditional on the beneficiary’s income and/or wealth falling below a specified level. Furthermore, most of the benefits in 2018 were cash benefits (€2.985,8 million), whereas benefits in kind constituted only 21,2% of the total of social protection benefits (€804,8 million). As regards cash benefits, 86,9% (€2.595,2 million) were provided periodically, for example pensions and other benefits, whereas lump sum benefits constituted 13,1% of the cash benefits (Chart 3).
Distribution of Social Protection Expenditure by Scheme
The Social Insurance Scheme is the largest provider of social benefits in Cyprus with benefits of €1.511,9 million in 2018, representing a share of 38,9% of the total benefits. The contribution of the scheme of Other Governmental Social Protection is also significant, with €706,2 million which represents a share of 18,2% of the total benefits. Then follows the scheme of the Central Government Health Services with €559,9 million and a share of 14,4%, the Civil Service Social Protection with €440,4 million and a share of 11,3% and the semi-autonomous Social Insurance Institutions with €327,1 million and a share of 8,4%. Smaller rates were recorded in the remaining schemes as indicated in Table 4.
|
Table 1 |
|
|
|
|
|
Expenditure by Type |
2015 |
2016 |
2017 |
2018 |
|
€ (εκ.) |
€ (εκ.) |
€ (εκ.) |
€ (εκ.) |
|
|
Social Protection Benefits |
3.495,5 |
3.597,7 |
3.640,6 |
3.790,6 |
|
Non-Means Tested |
2.991,5 |
3.060,6 |
3.092,9 |
3.241,3 |
|
Cash Benefits |
2.401,5 |
2.422,5 |
2.419,6 |
2.507,9 |
|
Periodic |
2.063,2 |
2.123,6 |
2.139,6 |
2.207,9 |
|
Lump Sum |
338,2 |
298,9 |
280,0 |
300,0 |
|
Benefits in Kind |
590,0 |
638,1 |
673,3 |
733,4 |
|
Means-Tested |
504,0 |
537,1 |
547,7 |
549,3 |
|
Cash Benefits |
438,7 |
462,3 |
477,6 |
477,9 |
|
Periodic |
384,9 |
402,4 |
400,1 |
387,3 |
|
Lump Sum |
53,8 |
59,9 |
77,5 |
90,6 |
|
Benefits in Kind |
65,3 |
74,7 |
70,1 |
71,4 |
|
Administrative Costs |
43,0 |
47,6 |
47,9 |
47,5 |
|
Other Expenditure |
44,5 |
35,7 |
36,1 |
46,8 |
|
Total Expenditure |
3.582,9 |
3.681,1 |
3.724,6 |
3.884,9 |
|
Table 2 |
|
|
|
|
|
Old Age Benefits |
2015 |
2016 |
2017 |
2018 |
|
€ (εκ.) |
€ (εκ.) |
€ (εκ.) |
€ (εκ.) |
|
|
Non-Means Tested |
1.670,4 |
1.666,1 |
1.710,7 |
1.767,5 |
|
Cash Benefits |
1.653,3 |
1.647,6 |
1.691,9 |
1.746,2 |
|
Periodic |
1.499,2 |
1.531,8 |
1.561,7 |
1.605,4 |
|
Lump Sum |
154,2 |
115,8 |
130,2 |
140,8 |
|
Benefits in Kind |
17,1 |
18,5 |
18,9 |
21,3 |
|
Means-Tested |
57,4 |
49,4 |
52,6 |
56,6 |
|
Cash Benefits |
57,1 |
49,4 |
52,6 |
56,6 |
|
Periodic |
57,1 |
46,6 |
49,9 |
53,4 |
|
Lump Sum |
0,0 |
2,8 |
2,7 |
3,2 |
|
Benefits in Kind |
0,3 |
0,0 |
0,0 |
0,0 |
|
Total Benefits |
1.727,8 |
1.715,5 |
1.763,4 |
1.824,1 |
|
Table 3 |
|
|
|
|
|
Social Protection Benefits by Function |
2015 |
2016 |
2017 |
2018 |
|
€ (εκ.) |
€ (εκ.) |
€ (εκ.) |
€ (εκ.) |
|
|
Sickness / Healthcare |
606,5 |
650,8 |
665,6 |
727,5 |
|
Disability |
124,4 |
152,5 |
164,1 |
175,7 |
|
Old Age |
1.727,8 |
1.715,5 |
1.763,4 |
1.824,1 |
|
Survivors |
252,3 |
260,0 |
267,6 |
274,3 |
|
Family / Children |
241,0 |
243,9 |
242,8 |
253,8 |
|
Unemployment |
252,8 |
244,8 |
208,0 |
209,6 |
|
Housing |
64,5 |
74,7 |
70,1 |
69,2 |
|
Social Exclusion |
226,2 |
255,5 |
259,1 |
256,5 |
|
Social Protection Benefits |
3.495,5 |
3.597,7 |
3.640,6 |
3.790,6 |
|
Table 4 |
|
|
|
|
|
Social Protection Schemes |
2015 |
2016 |
2017 |
2018 |
|
€ (εκ.) |
€ (εκ.) |
€ (εκ.) |
€ (εκ.) |
|
|
Social Insurance Scheme |
1.389,1 |
1.423,0 |
1.457,1 |
1.511,9 |
|
Civil Service Social Protection |
455,6 |
426,5 |
428,5 |
440,4 |
|
Central Government Health Services |
459,6 |
475,7 |
516,2 |
559,9 |
|
Other Governmental Social Protection |
633,2 |
665,7 |
687,7 |
706,2 |
|
Local Government Schemes |
11,0 |
12,1 |
13,1 |
12,7 |
|
Semi-autonomous Social Insurance Institutions |
337,5 |
316,3 |
313,3 |
327,1 |
|
Non-governmental Organisations |
67,8 |
75,2 |
78,4 |
81,8 |
|
Labour Market Social Protection |
64,4 |
84,9 |
54,2 |
59,0 |
|
Employer as Provider of Social Protection |
100,4 |
126,9 |
105,6 |
116,2 |
|
Housing |
64,2 |
74,7 |
70,5 |
69,6 |
|
Total Expenditure |
3.582,9 |
3.681,1 |
3.724,6 |
3.884,9 |
Methodological notes
Survey Characteristics
According to the relevant Eurostat Manual, 2019 edition, the European System of Integrated Social PRΟtection Statistics (ESSPROS) provides a coherent comparison between EU and EFTA countries, of social benefits to households and their financing. Social Protection encompasses all interventions from public or private bodies intended to relieve households and individuals of the burden of a defined set of risks or needs, provided that there is not a simultaneous reciprocal or individual arrangement involved (i.e., the beneficiary is not obliged to provide simultaneously something of equivalent value in exchange).
Goals of the Survey
The collection of these data aims at the best possible presentation of the information, based on uniform principles and rules that characterize ESSPROS and which are accepted in all EU member states. The Survey on Social Protection conducted by the Statistical Service and the publication of the results, contributes to the drawing of useful conclusions pertaining to our country’s policy in this sector, while the results may be exploited in the framework of policy making, taking at the same time into consideration the current situation in the other European countries.
Coverage and Data Collection
The survey covered all organizations, services and insurance funds (autonomous or not) in Cyprus, which offer benefits towards one or more of the Social Protection functions (disability, sickness, old age, survivors, family/children, unemployment, housing and social exclusion). The collection of the data for Social Protection takes place from administrative sources, inter alia, the annual State Budget, selected Ministries’ annual reports, the financial reports of organizations that concern social protection (for example the Provident Funds and the Surplus Personnel Fund) and the financial reports of NGOs. For the collection of additional data, the Statistical Service conducted postal surveys, by sending questionnaires to semi-governmental organizations, municipal authorities, Commercial and Cooperative Banks, Trade Unions, Insurance Companies and to a sample of private companies.
Social Protection Schemes in Cyprus
The basic methodology of ESSPROS determines that the total of social benefits is provided through different schemes or functions. These schemes are independent groups of rules which offer social benefits and differ between countries, depending on the structure and operation of the national social insurance system. The social insurance system which is in operation in Cyprus has been classified into ten (10) schemes, according to the types and particularities of the benefits. These schemes are:
The Social Insurance Scheme comprises the social benefits granted by the Department of Social Insurance Services of the Ministry of Labour, Welfare and Social Insurance.
Civil Service Social Protection: this scheme comprises the pension protection of the Government, in its capacity as employer, towards civil servants (pensions and retirement gratuities to all ex-staff of the Central Government).
Central Government Health Services: this scheme comprises the provision of medical care and pharmaceutical products in public hospitals and the provision of medical care abroad (where necessary). The services are provided at reduced fee for certain groups of patients such as the elderly, the unemployed, civil servants etc.
Other Governmental Social Protection pertains to several types of benefits provided by Ministries for the purpose of supporting the more vulnerable population groups by relieving them of the burden of needs such as disability, old age, family/children and social exclusion.
Local Government schemes comprise the benefits provided by the local authorities (municipalities and communities) both for their employees, in their capacity as employer, and for their residents who may face need or risk.
Semi-autonomous Social Insurance Institutions: this scheme comprises the collective benefits provided by semi-governmental organizations for their employees, in their capacity as employer, and the sum of benefits of the Provident Funds provided for the employed persons, under the state’s supervision.
Non-Governmental Organizations: this schemecomprises mainly benefits addressing the functions of sickness, disability, old age and family/children, provided by NGOs for their members and the rest of the population.
Labour Market Social Protection: this scheme comprises benefits of semi-autonomous funds or organizations towards the support of employment and the reduction of unemployment, under the state’s supervision.
Employer as Provider of Social Protection pertains to healthcare benefits provided by enterprises and organizations of the private sector, for their employees.
Housing: this scheme comprises public benefits for housing towards the covering of needs of certain population groups, like refugees.
For more information visit the Statistical Service (CYSTAT) website, subtheme Living Conditions and Social Protection or contact Ms Eleni Haperi: tel.: +35722602157, email: ehaperi@cystat.mof.gov.cy or Ms Georgia Ioannou: tel.: +35722602144, email: gioannou@cystat.mof.gov.cy
(EK/SCH)
Relevant Press Releases

18-11-2024 14:15
Price Index of Construction Materials: October 2024
15-11-2024 15:12
Road Freight Transport: 2nd Quarter 2024
14-11-2024 13:52
GDP Growth Rate: 3rd quarter 2024 (Flash Estimate)